Results
Every number on this page comes from 19 years of historical data, from January 2007 through December 2025. We show everything — the gains, the losses, and the stress tests that tell us these results weren’t a fluke.
Year-by-Year Performance
No strategy wins every year, and we think you should see every result before subscribing — good and bad. In 2008, the S&P 500 lost 37% and a traditional 60/40 portfolio lost 20%. Our strategies limited losses to single digits. In 2022, when stocks and bonds fell together for the first time in decades, all four strategies held up while 60/40 portfolios suffered their worst year since the financial crisis.
The table below shows every calendar year since inception. Teal numbers are positive. Red numbers are negative. The two columns on the right — S&P 500 and 60/40 — are what most investors hold. Compare them row by row, especially in the bad years. That’s where systematic rules earn their keep: not by avoiding all losses, but by keeping them manageable while still capturing most of the upside.
| Year | SRM+ | Growth | Core Mom. | Fortress | S&P 500 | 60/40 |
|---|---|---|---|---|---|---|
| 2007 | 21.4% | 12.8% | 5.5% | 12.0% | 5.3% | 6.1% |
| 2008 | 1.8% | 2.1% | −5.6% | 6.9% | −36.8% | −20.0% |
| 2009 | 9.9% | 19.8% | 22.6% | 8.2% | 26.4% | 17.5% |
| 2010 | 19.0% | 13.4% | 8.9% | 12.6% | 15.1% | 12.0% |
| 2011 | 19.4% | 5.4% | 3.5% | 9.2% | 1.9% | 5.0% |
| 2012 | 0.4% | 6.5% | 11.7% | 6.2% | 16.0% | 11.2% |
| 2013 | 26.2% | 19.6% | 31.0% | 3.4% | 32.3% | 17.5% |
| 2014 | 15.9% | 10.9% | 9.9% | 8.4% | 13.5% | 10.6% |
| 2015 | −5.8% | −1.7% | −8.2% | −2.9% | 1.2% | 1.3% |
| 2016 | 11.7% | 14.7% | 4.1% | 8.2% | 12.0% | 8.3% |
| 2017 | 20.2% | 20.0% | 20.9% | 11.2% | 21.7% | 14.2% |
| 2018 | 0.6% | −0.6% | 1.4% | −0.5% | −4.6% | −2.3% |
| 2019 | 5.1% | 17.8% | 15.2% | 13.4% | 31.2% | 21.9% |
| 2020 | 27.2% | 22.3% | 18.9% | 15.8% | 18.3% | 15.4% |
| 2021 | 27.7% | 20.9% | 31.4% | 8.4% | 28.7% | 15.8% |
| 2022 | −3.7% | −15.2% | −13.7% | −12.4% | −18.2% | −15.6% |
| 2023 | 20.7% | 20.5% | 19.3% | 12.1% | 26.2% | 17.8% |
| 2024 | 10.9% | 21.1% | 11.0% | 12.2% | 24.9% | 15.1% |
| 2025 | 22.1% | 15.7% | 13.3% | 17.1% | 18.6% | 14.5% |
| CAGR | 12.8% | 11.5% | 10.0% | 7.6% | 10.7% | 8.2% |
What If History Had Played Out Differently?
A track record shows what happened. A stress test asks: what could have happened? We took 19 years of monthly returns and reshuffled them into 10,000 different sequences — different orders of good months and bad months, bull markets and corrections — and ran each strategy through all of them.
The shaded area in each chart shows where 90% of those paths landed. The gold line is what actually happened. When the gold line sits in the middle of the shaded area, the historical result wasn’t unusually lucky or unlucky — it’s what you’d typically expect from this set of rules. That’s important because it means the results above aren’t a product of one lucky sequence of markets.
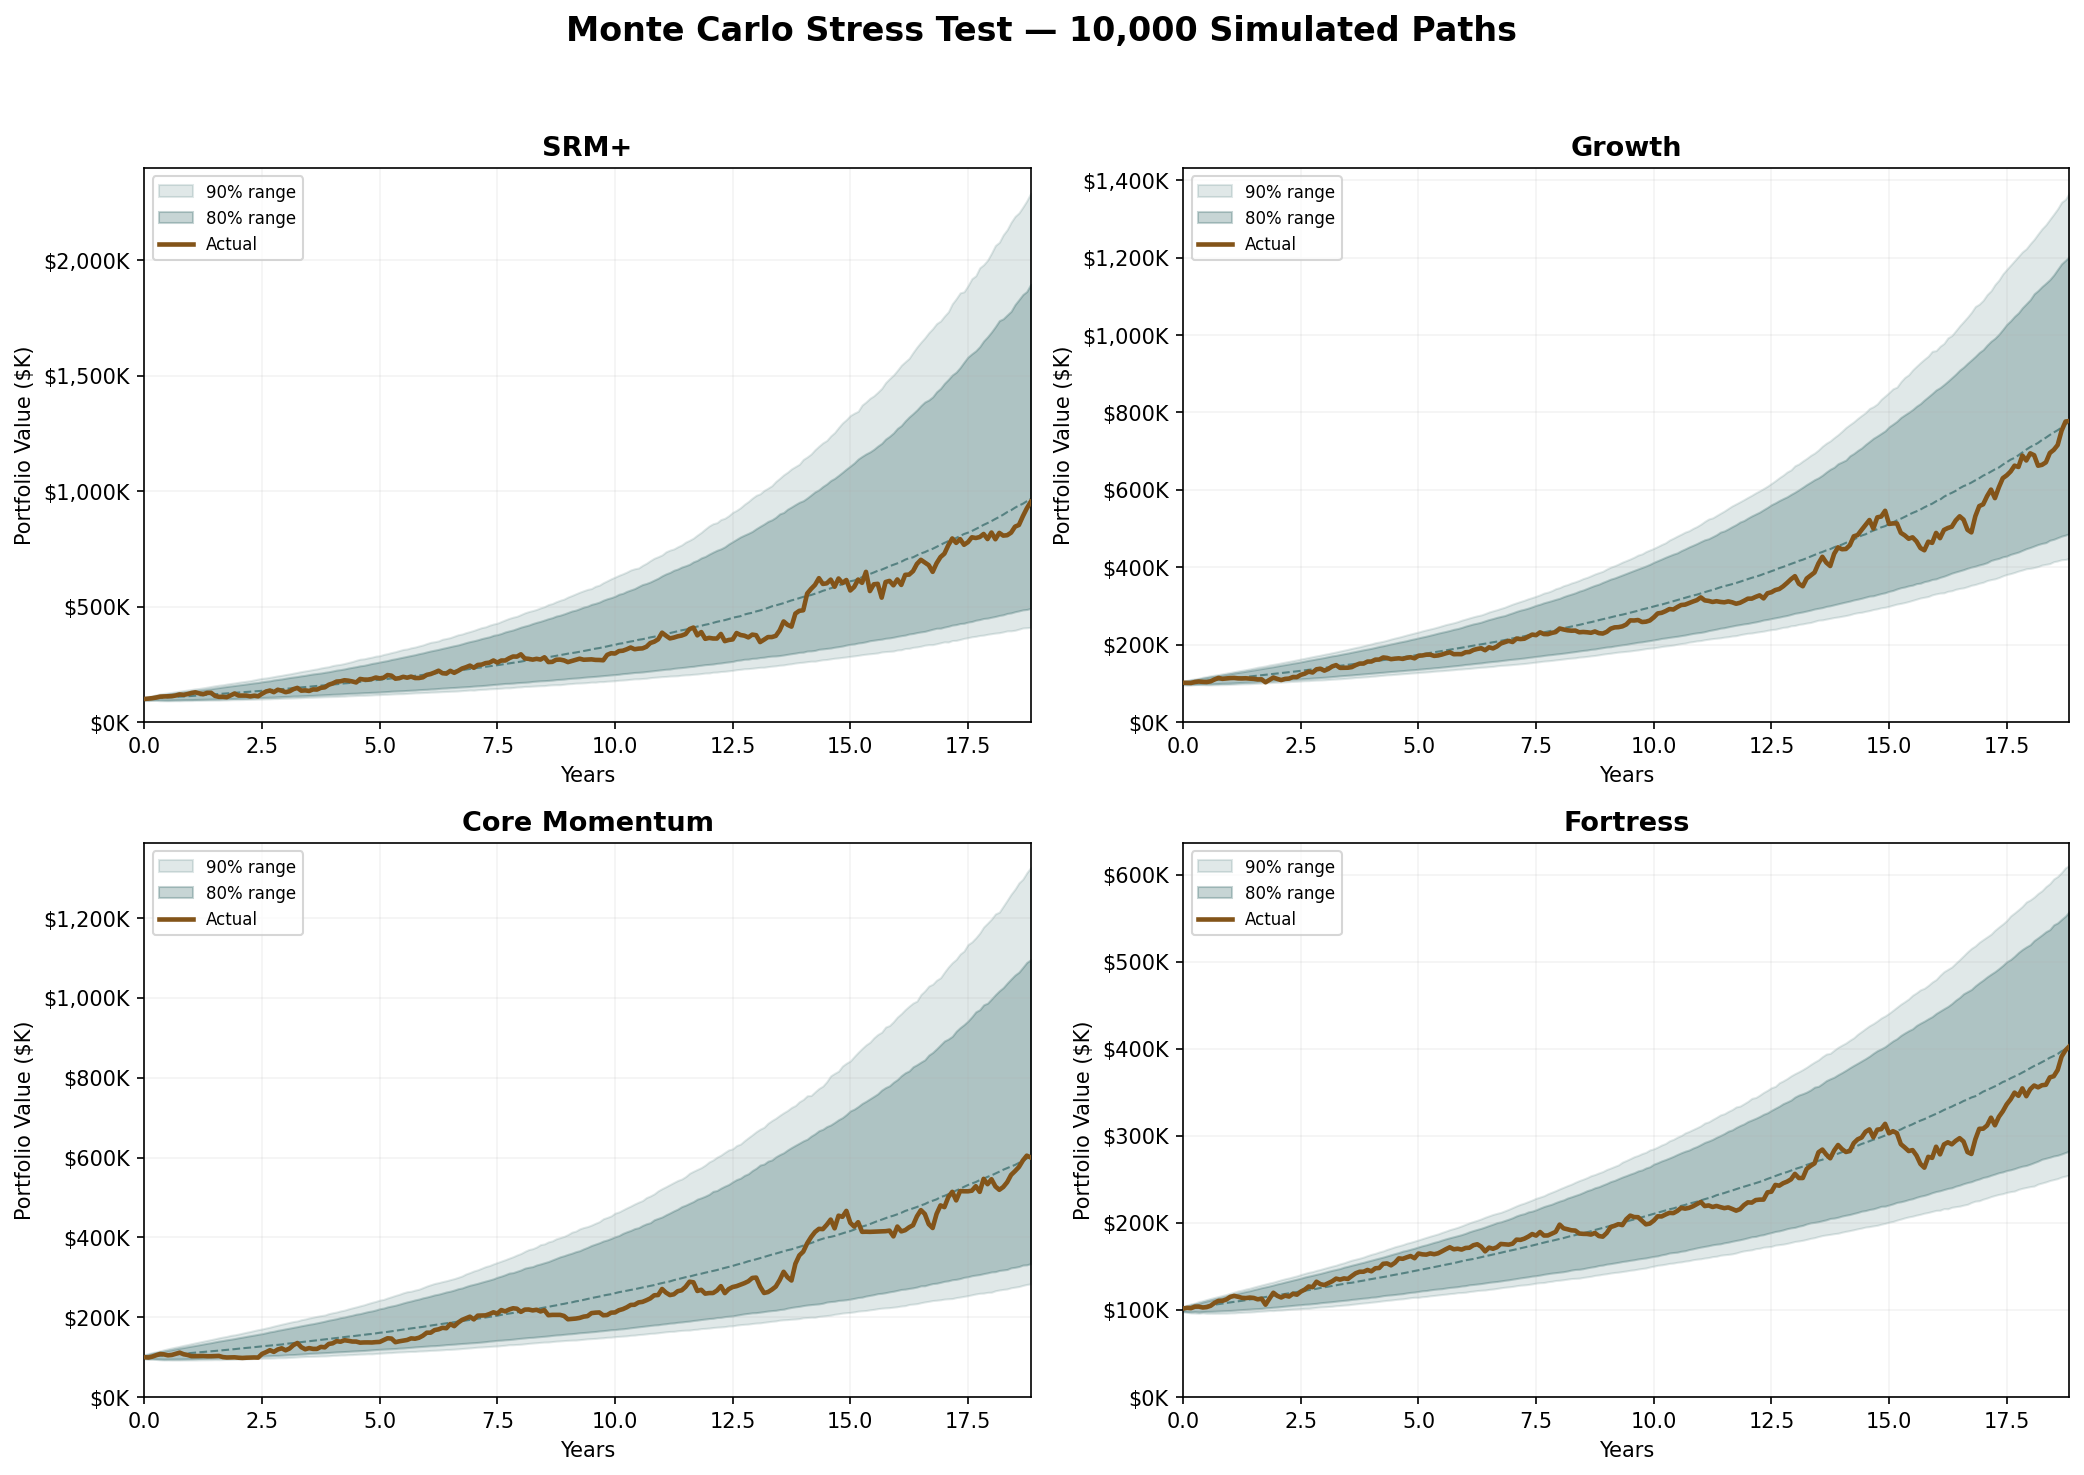
SRM+
Growth
Core Momentum
Fortress
Tested on Data They Never Saw
When you build rules on historical data, there’s always a question: do they work because the logic is sound, or because they were unknowingly shaped to fit the past? The standard way to answer this is to split the data in two. Build on the first half, then test on the second half without changing anything. If the rules only worked by fitting noise, performance collapses on new data.
We built all four strategies using data from 2007 through 2016, then ran them on 2017 through 2025 — nine years they had never seen, including the COVID crash, the 2022 bond rout, and the 2023–24 AI rally. Performance didn’t collapse. Every single strategy improved. The number shown is the Sharpe ratio — return per unit of risk. Higher is better, and improvement on unseen data is rare.
Most strategies degrade when tested outside their development window. All four improved — the rules capture genuine market patterns, not statistical artifacts.
Built on Peer-Reviewed Science
Our strategies use two of the most documented and persistent phenomena in financial markets: trend-following and momentum. These aren’t proprietary discoveries — they’re well-established effects validated across decades of research, multiple asset classes, and over a century of market data.
All returns assume reinvestment of dividends and do not account for taxes, transaction costs, or management fees beyond standard ETF expense ratios. The Monte Carlo stress test reshuffles historical returns into different sequences — it does not model market conditions outside the 2007–2025 sample period. Out-of-sample validation uses a fixed 2007–2016 development window and 2017–2025 test window with no parameter changes between periods. Peregrine Research provides portfolio model subscriptions; we do not manage money or provide personalized financial advice. Consult a qualified financial advisor before making investment decisions.